Austria
  Azerbaijan
  Bosnia and Herzegovina
  Bulgaria
  Croatia
  Czech Republic
  Denmark
  Estonia
  Finland
  Georgia
  Germany
  Hungary
  Kazakhstan
  Kyrgyzstan
  Latvia
  Lithuania
  Moldova
  Montenegro
  North Macedonia
  Norway
  Poland
  Romania
  Serbia
  Slovakia
  Slovenia
  Sweden
  Switzerland
  Tajikistan
  Turkmenistan
  Ukraine
  Uzbekistan


In today’s world of software development, team efficiency is critical. According to the “State of DevOps Report”, only circa 40% of developers’ time is truly productive, and 36% of specialists quit companies because of the inability to access code-level data. This is a problem that most developers face when troubleshooting and debugging programs. They have to go through long deployment and log analysis cycles to find the relevant data needed to understand what is happening in their running code.
To avoid this, it is crucial to provide developers with a solution that offers instant access to the data they need, regardless of the environment.
Dynatrace aims to change this situation. Live Debugger allows you to reduce the time it takes to find and fix errors in the product environment by up to 80%. This positively impacts the work process, reducing stress levels, increasing satisfaction, and improving product stability.
Dynatrace Live Debugger: What is it?
Dynatrace Live Debugger is an innovative feature that allows developers to easily find errors in code without having to change the application logic or add temporary logging.
Previously, fixing errors in a production environment required creating a test environment or risky intervention in a running system. Now, everything is much simpler:
- No need for additional logging.
- No need to create separate debug collections.
- Application works without restarts and stops.
Live Debugger allows you to set non-breaking breakpoints in real time and collect snapshots of variable state and program execution — all without compromising system performance.
This technology is perfect for detecting “intermittent” errors that are difficult or nearly impossible to reproduce in a test environment.
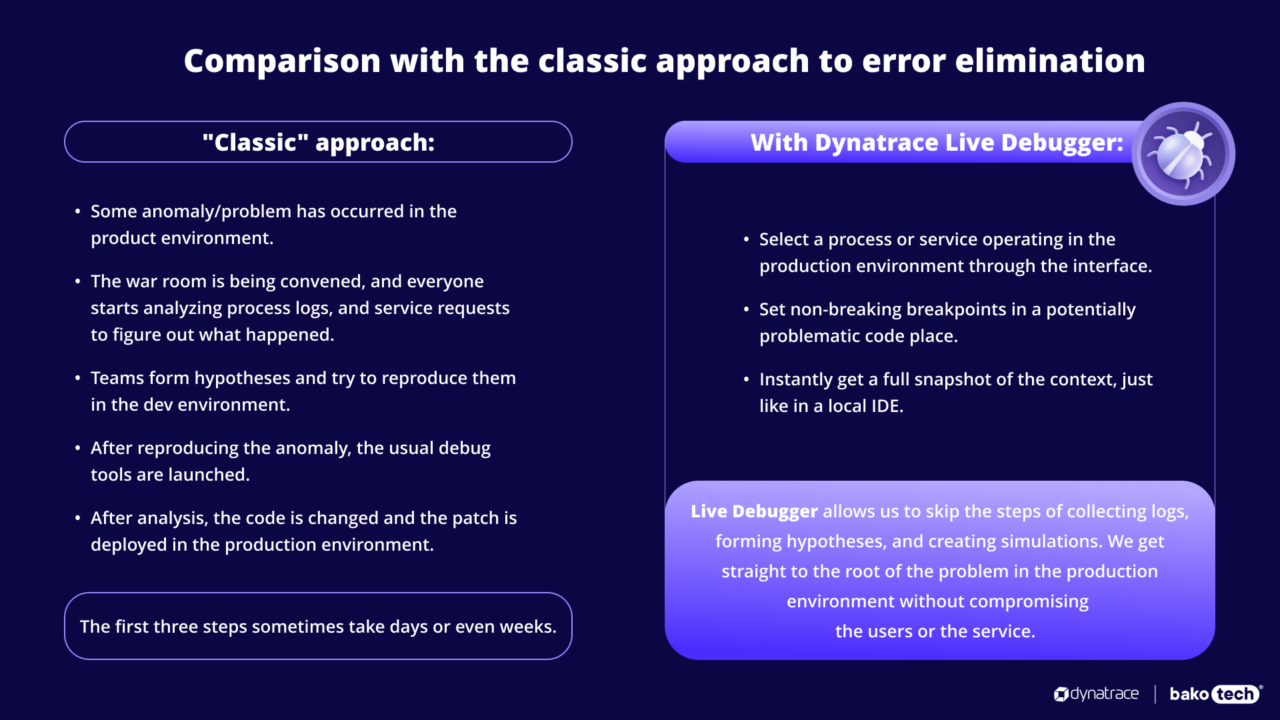
Let’s look at how Live Debugger helps developers fix even the most complex errors faster and better without compromising system performance or stability, using the classic approach and the one proposed by Dynatrace as an example.
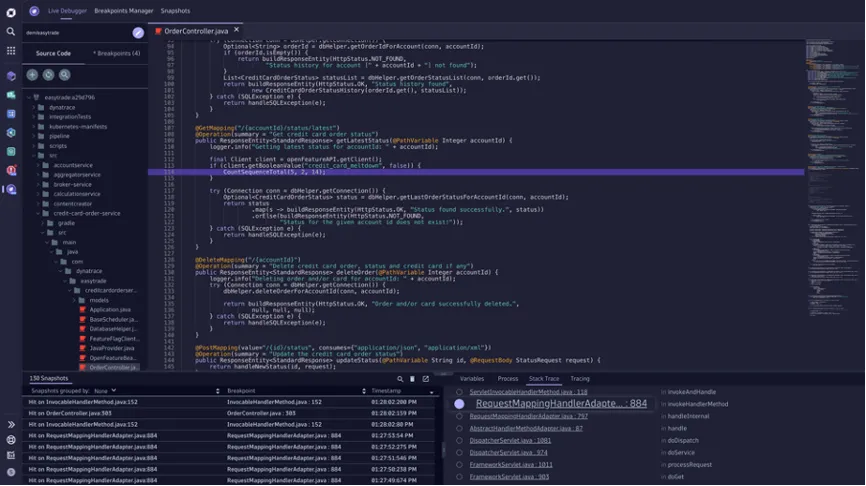
How does Live Debugger work?
To use Live Debugger, you need to follow a few simple steps:
- Select a process or service, which needs to be analyzed. This could be a Kubernetes container, a specific host, or an IP address.
- Include source code. Dynatrace never copies or distributes source code to external servers.
➔All code remains within your network, protected by your firewall, and access to repositories occurs locally from the developer’s workstation. This means that the entire analysis process runs in a browser or IDE without leaking data anywhere outside. - Set non-breaking points at the right place in the code. Using a special plugin, they can be placed via Dynatrace UI or directly from your favorite IDE (for example, VS Code or IntelliJ).
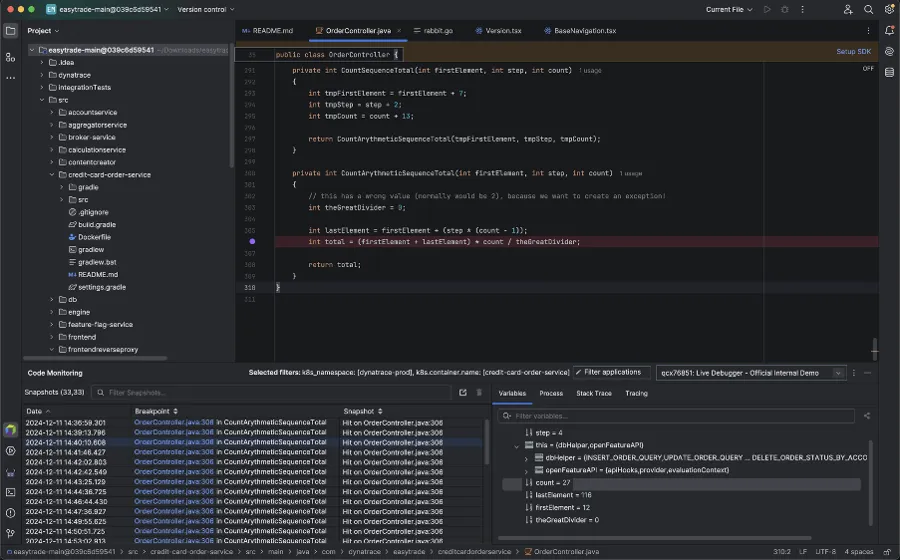
- Get snapshots of the state of variables, call stack, and environment whenever the code execution reaches breakpoint.
- Analyze the collected data, identify the cause of the problem and make corrections.
The Live Debugger experience is very similar to the traditional debugging process in a local IDE: you see the source tree, open the code you need, place points, and get instant snapshots of the data, but without stopping or restarting the application.
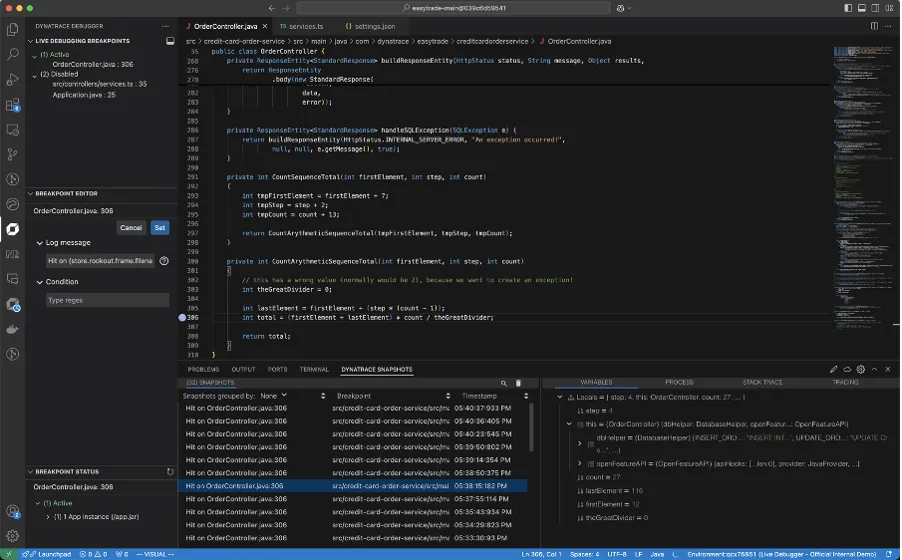
Integrate Live Debugger with your favorite IDEs
To make your work even more comfortable, Dynatrace offers Plugins for popular development environments, in particular:
- Visual Studio Code — “Observability for Developers” extension.
- JetBrains IDE — integration with IntelliJ IDEA, PyCharm, WebStorm and others.
Through the plugin you can:
- View the source tree directly in the IDE.
- Set non-breaking breakpoints in one click.
- Get snapshots of execution directly in your development environment.
This makes Live Debugging feel as familiar and natural as regular local analysis, but now it’s available in a live production environment.
Summary
Dynatrace Live Debugger opens a new era in application debugging:
- You get all the information you need about errors without interfering with the production environment.
- You reduce your troubleshooting time by 80%.
- You increase developer satisfaction and productivity.
Want to learn more about the solution? Contact us at [email protected] — we will help you implement and use Live Debugger to its full potential.